Surveys
The Surveys feature allows you to bring survey data into Magnolia, code the answers to open-ended questions, and see at a glance how closed questions were answered. A survey stays together as one document in your project: it isn't broken up into a document for each respondent.
Importing a survey
Magnolia reads surveys saved as .csv or .xlsx files. It recognises exports from SurveyMonkey and Microsoft Forms, and reads any other spreadsheet with one row for each respondent and one column for each question.
To import a survey:
Import the file as you would any other document. See Importing documents.
Magnolia shows a preview of the survey before it is added. Check the survey's name, and check the type Magnolia has given each column:
Type Use Open-endedFree-text answers, which you can code. Single choiceQuestions where each respondent picked one option. Multi-selectQuestions where each respondent could pick several options. NumericAnswers that are numbers, such as ratings or ages. MetadataInformation about the respondent rather than an answer, such as their ID or the date they responded. SkipColumns you don't want to import. If Magnolia has guessed a type wrongly, choose the right one from the menu beside the column.
Click
Import. The button shows how many respondents will be imported, for exampleImport 28 Respondents.
The survey appears in the Documents Panel. Under it are its Respondents and its Questions.
Reading a survey
A survey can be read in three ways:
- The summary, which opens when you open the survey. It lists every question, with how many respondents answered it and how its answers were spread, and then every respondent, with how many questions they answered;
- A respondent's answers. Click a respondent under
Respondentsin the Documents Panel to read all of their answers, one question after another; and, - A question's answers. Click a question under
Questionsin the Documents Panel to read every respondent's answer to it.
In the summary, click a question or a respondent to go to their answers.
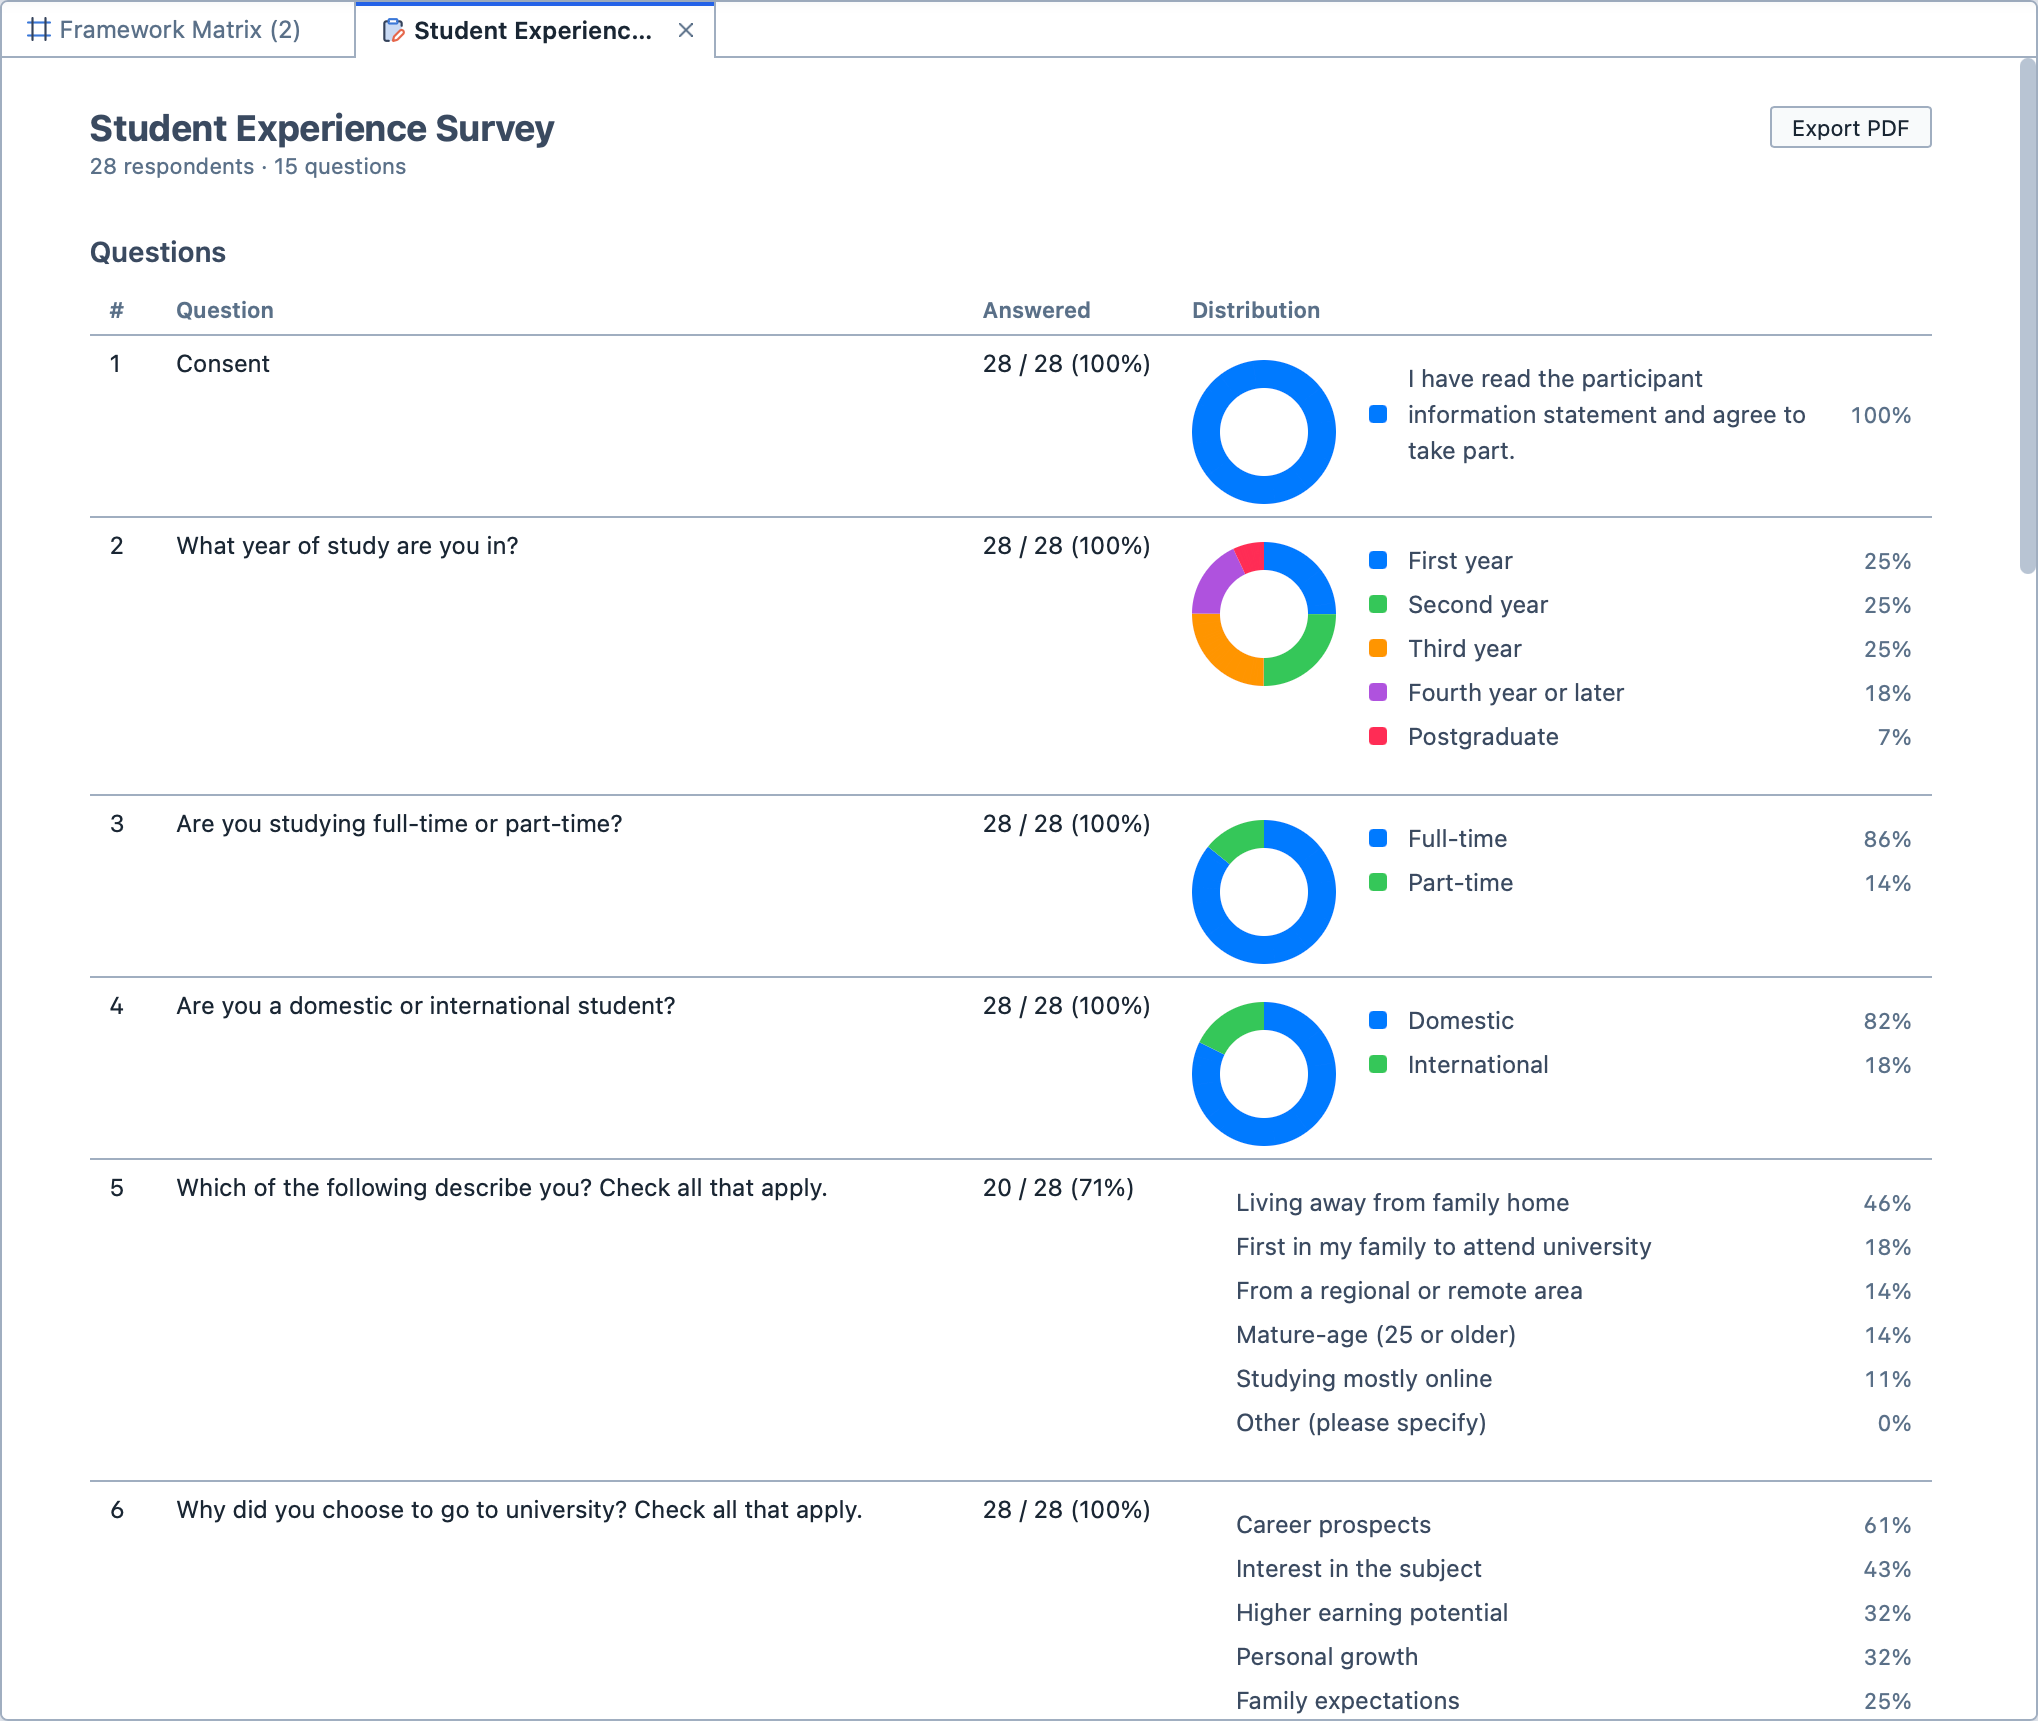
For closed questions, Magnolia draws the spread of the answers: the share of respondents who chose each option, or a box plot for numeric answers. When you read a respondent's answers, their own answer is ticked on each chart, so you can see where they sit among the other respondents.
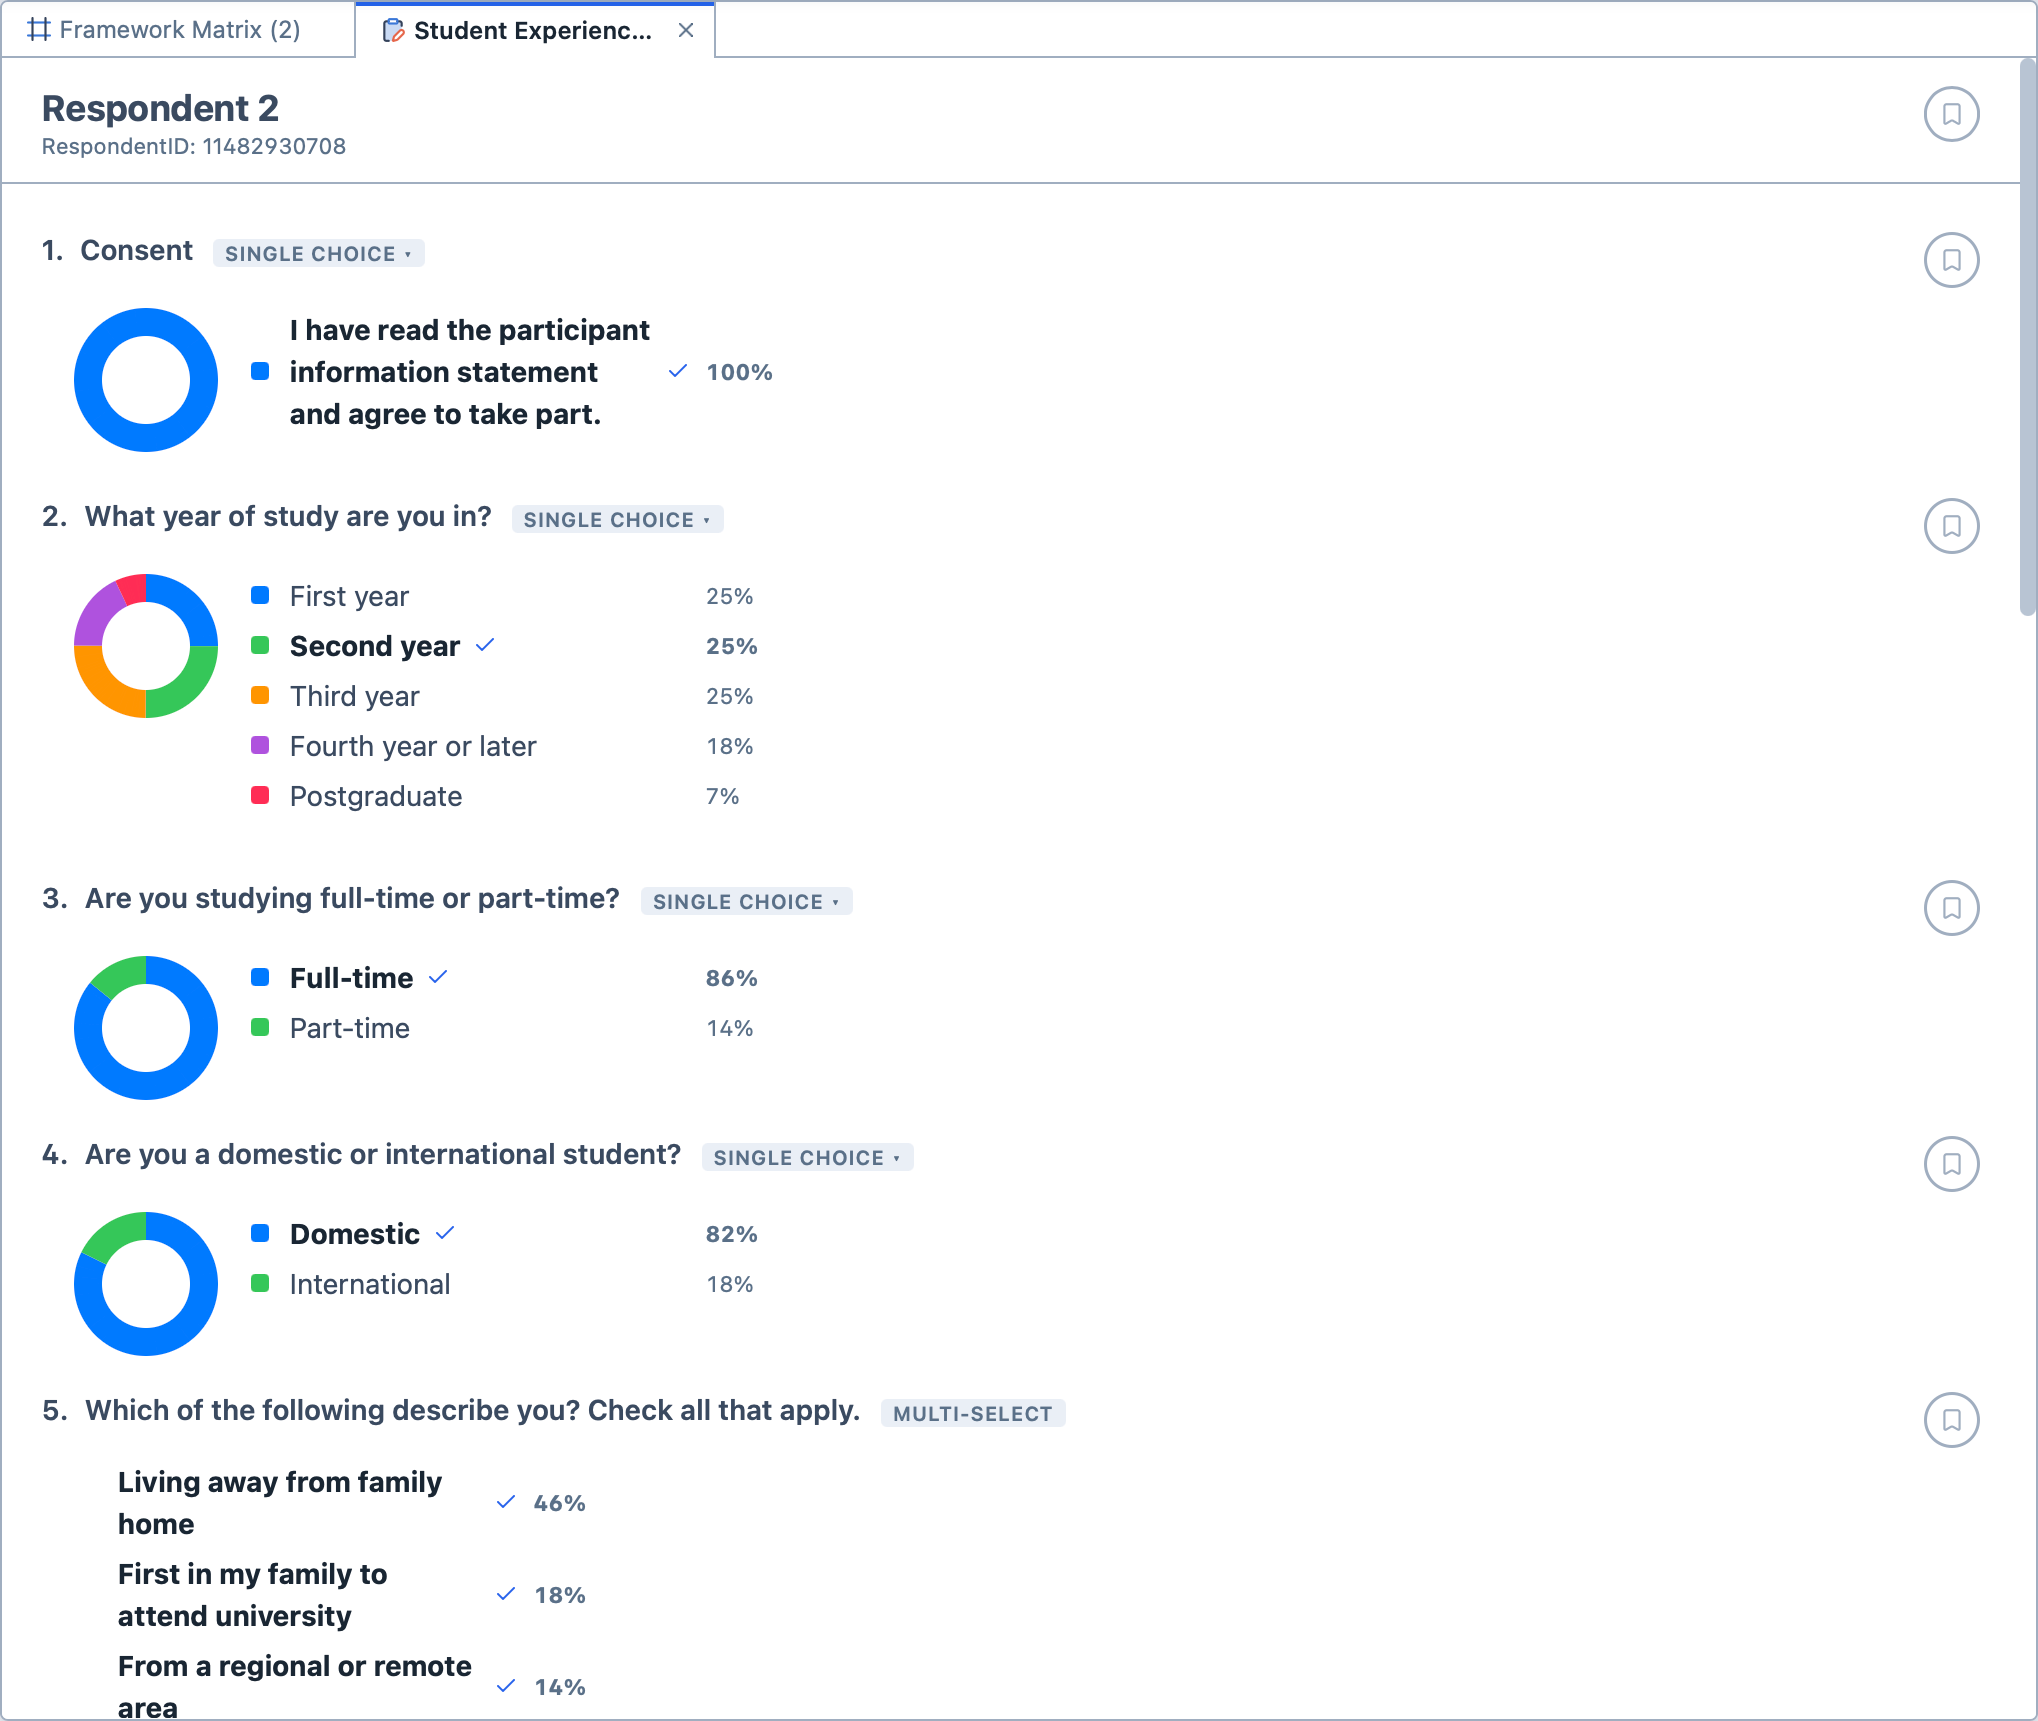
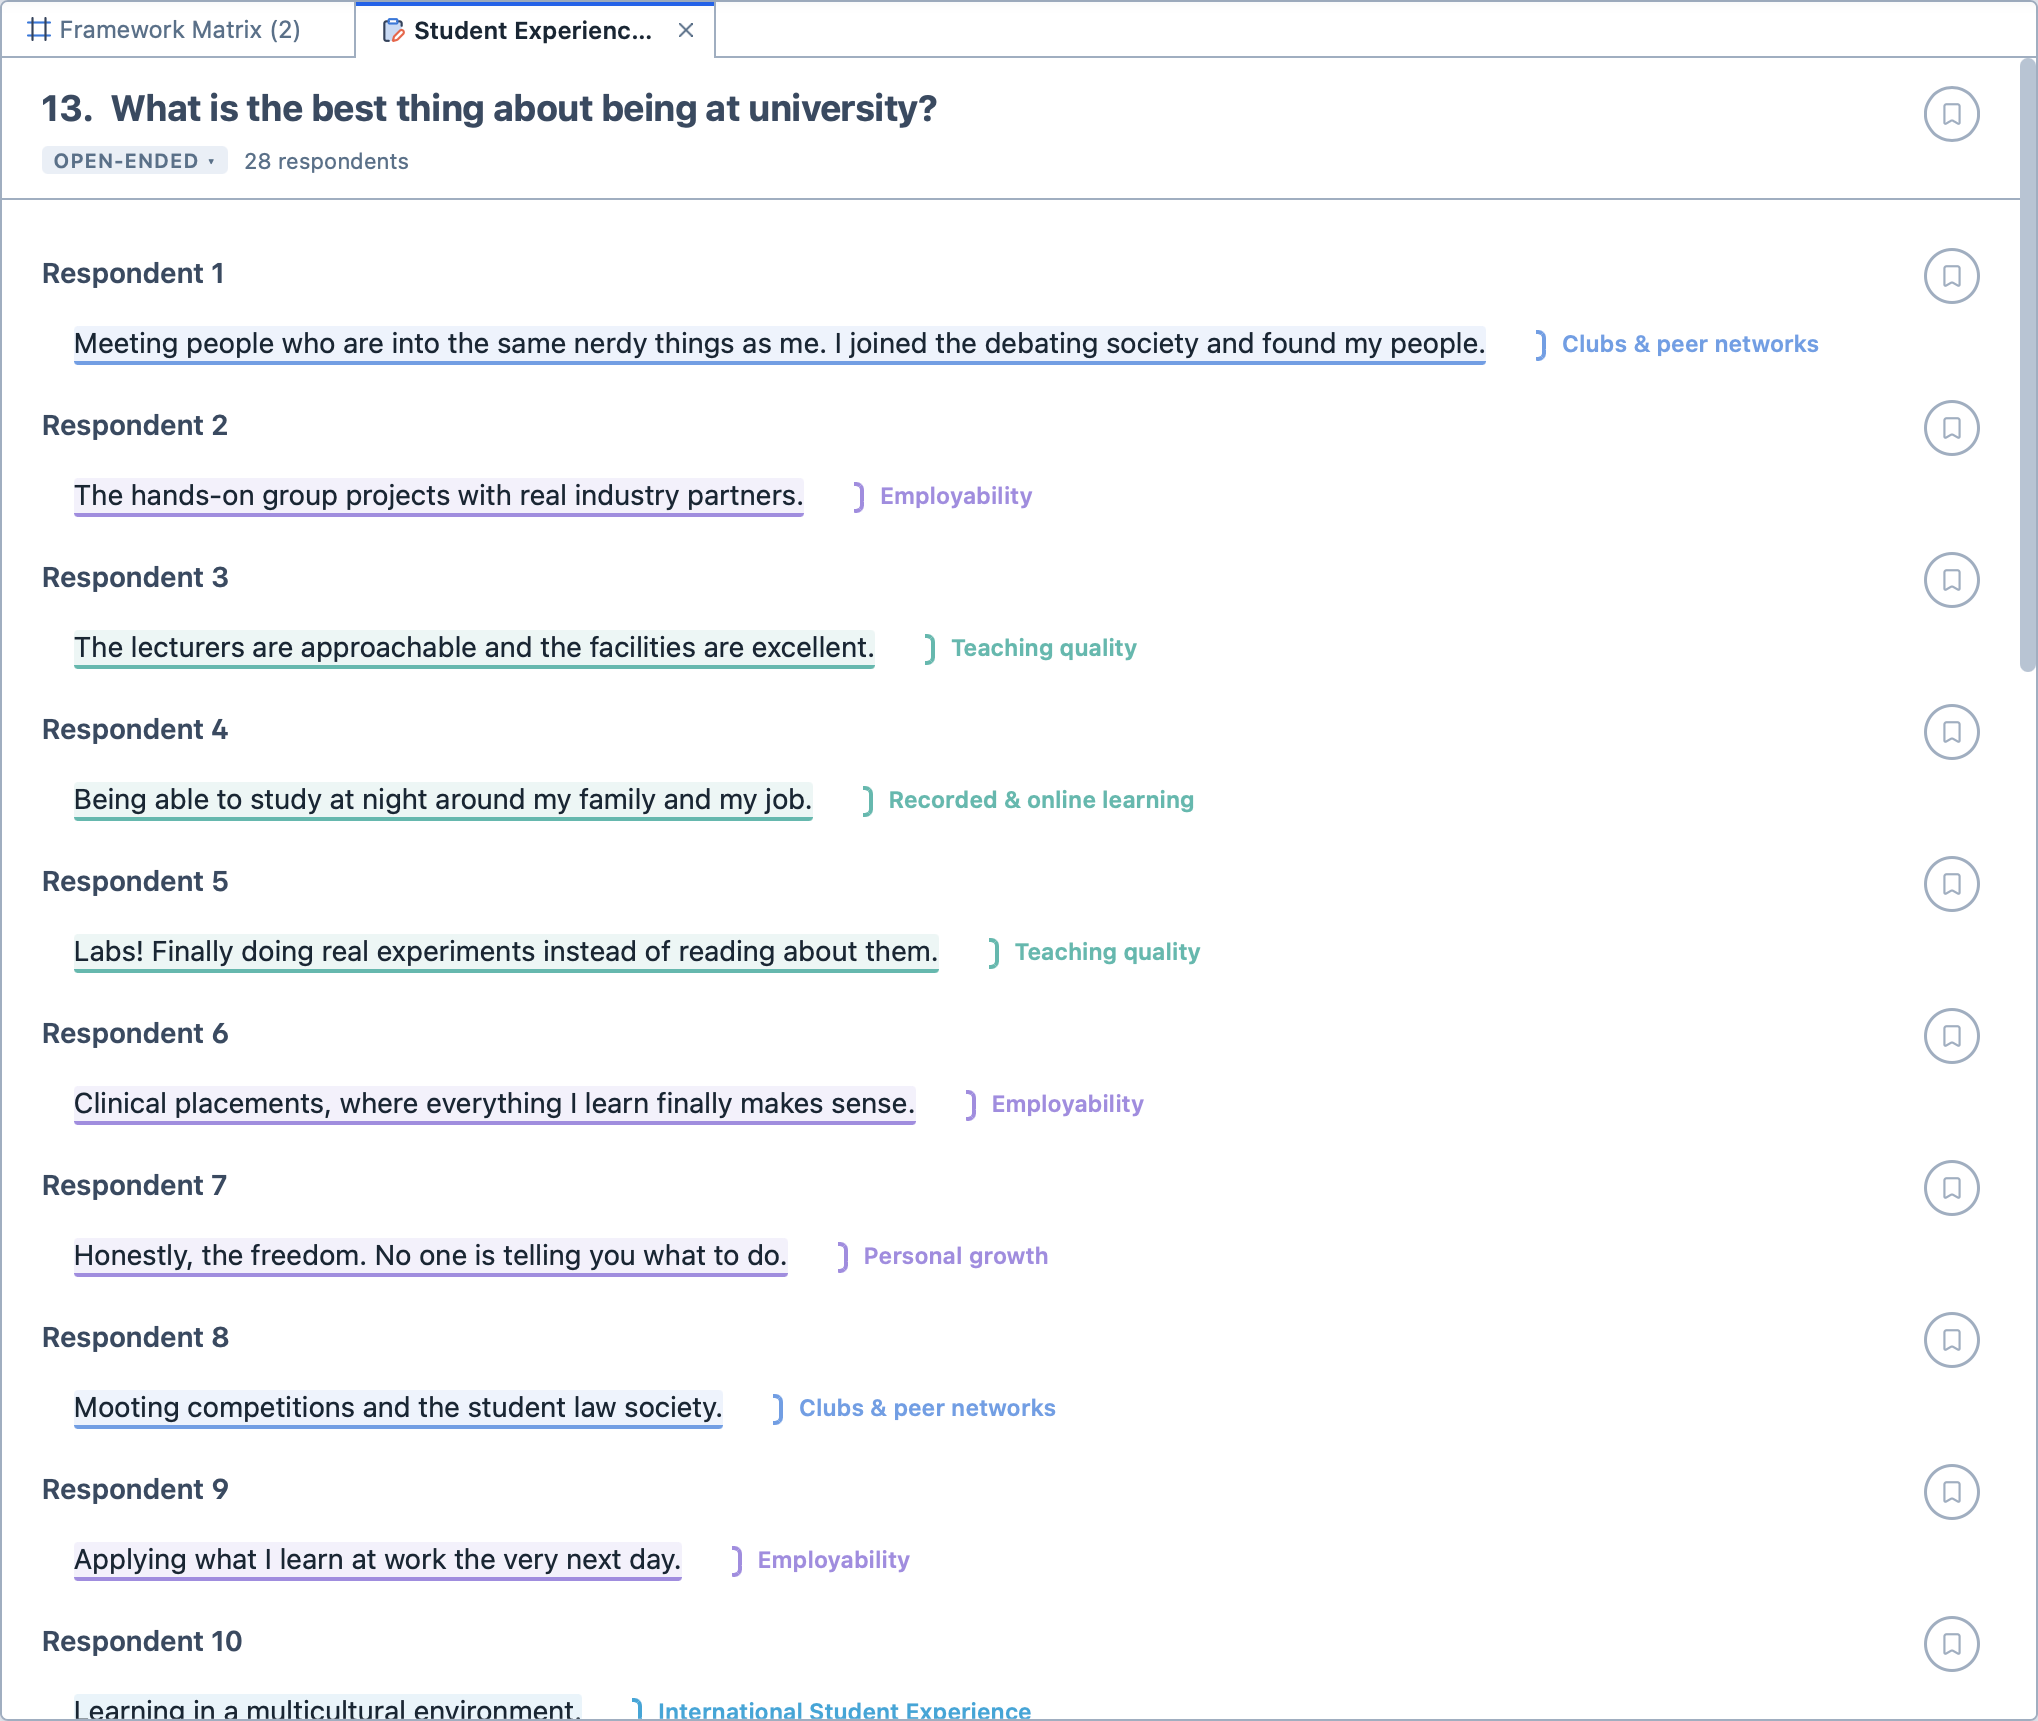
Each question shows its type beside it. If a question has the wrong type, click its type and choose another. A question with one column can be open-ended, single choice or numeric; a multi-select question stays multi-select.
Coding answers
You code a respondent's answers just as you would any other text. See Coding your data.
To code an answer:
Open the respondent's or the question's answers.
Select the text you wish to code. A selection can run across several answers.
Drag a code from the Code Browser onto the selection; or,
Press the code's hotkey; or,
Click the button on the end of the selection, or right-click the selection, and choose a code under
Apply Code.
When a selection runs across several answers, each answer is coded separately, so that every coded passage still belongs to one respondent.
You can also attach memos and quotes to answers. A memo can be attached to a whole survey, a respondent, a question, or one respondent's answer to one question. See What is a memo?.
Tagging respondents and questions
You can tag respondents and questions just as you tag documents. Drag a tag onto a respondent or a question in the Documents Panel.
Tags let you group respondents in the analysis tools. For example, you might tag each respondent as a domestic or an international student, then compare how the two groups answered. See Grouping.
Exporting a summary
Click Export PDF in the survey's summary to save it as a PDF. The PDF includes the spread of answers to every closed question, and every respondent's answers to the open-ended questions.